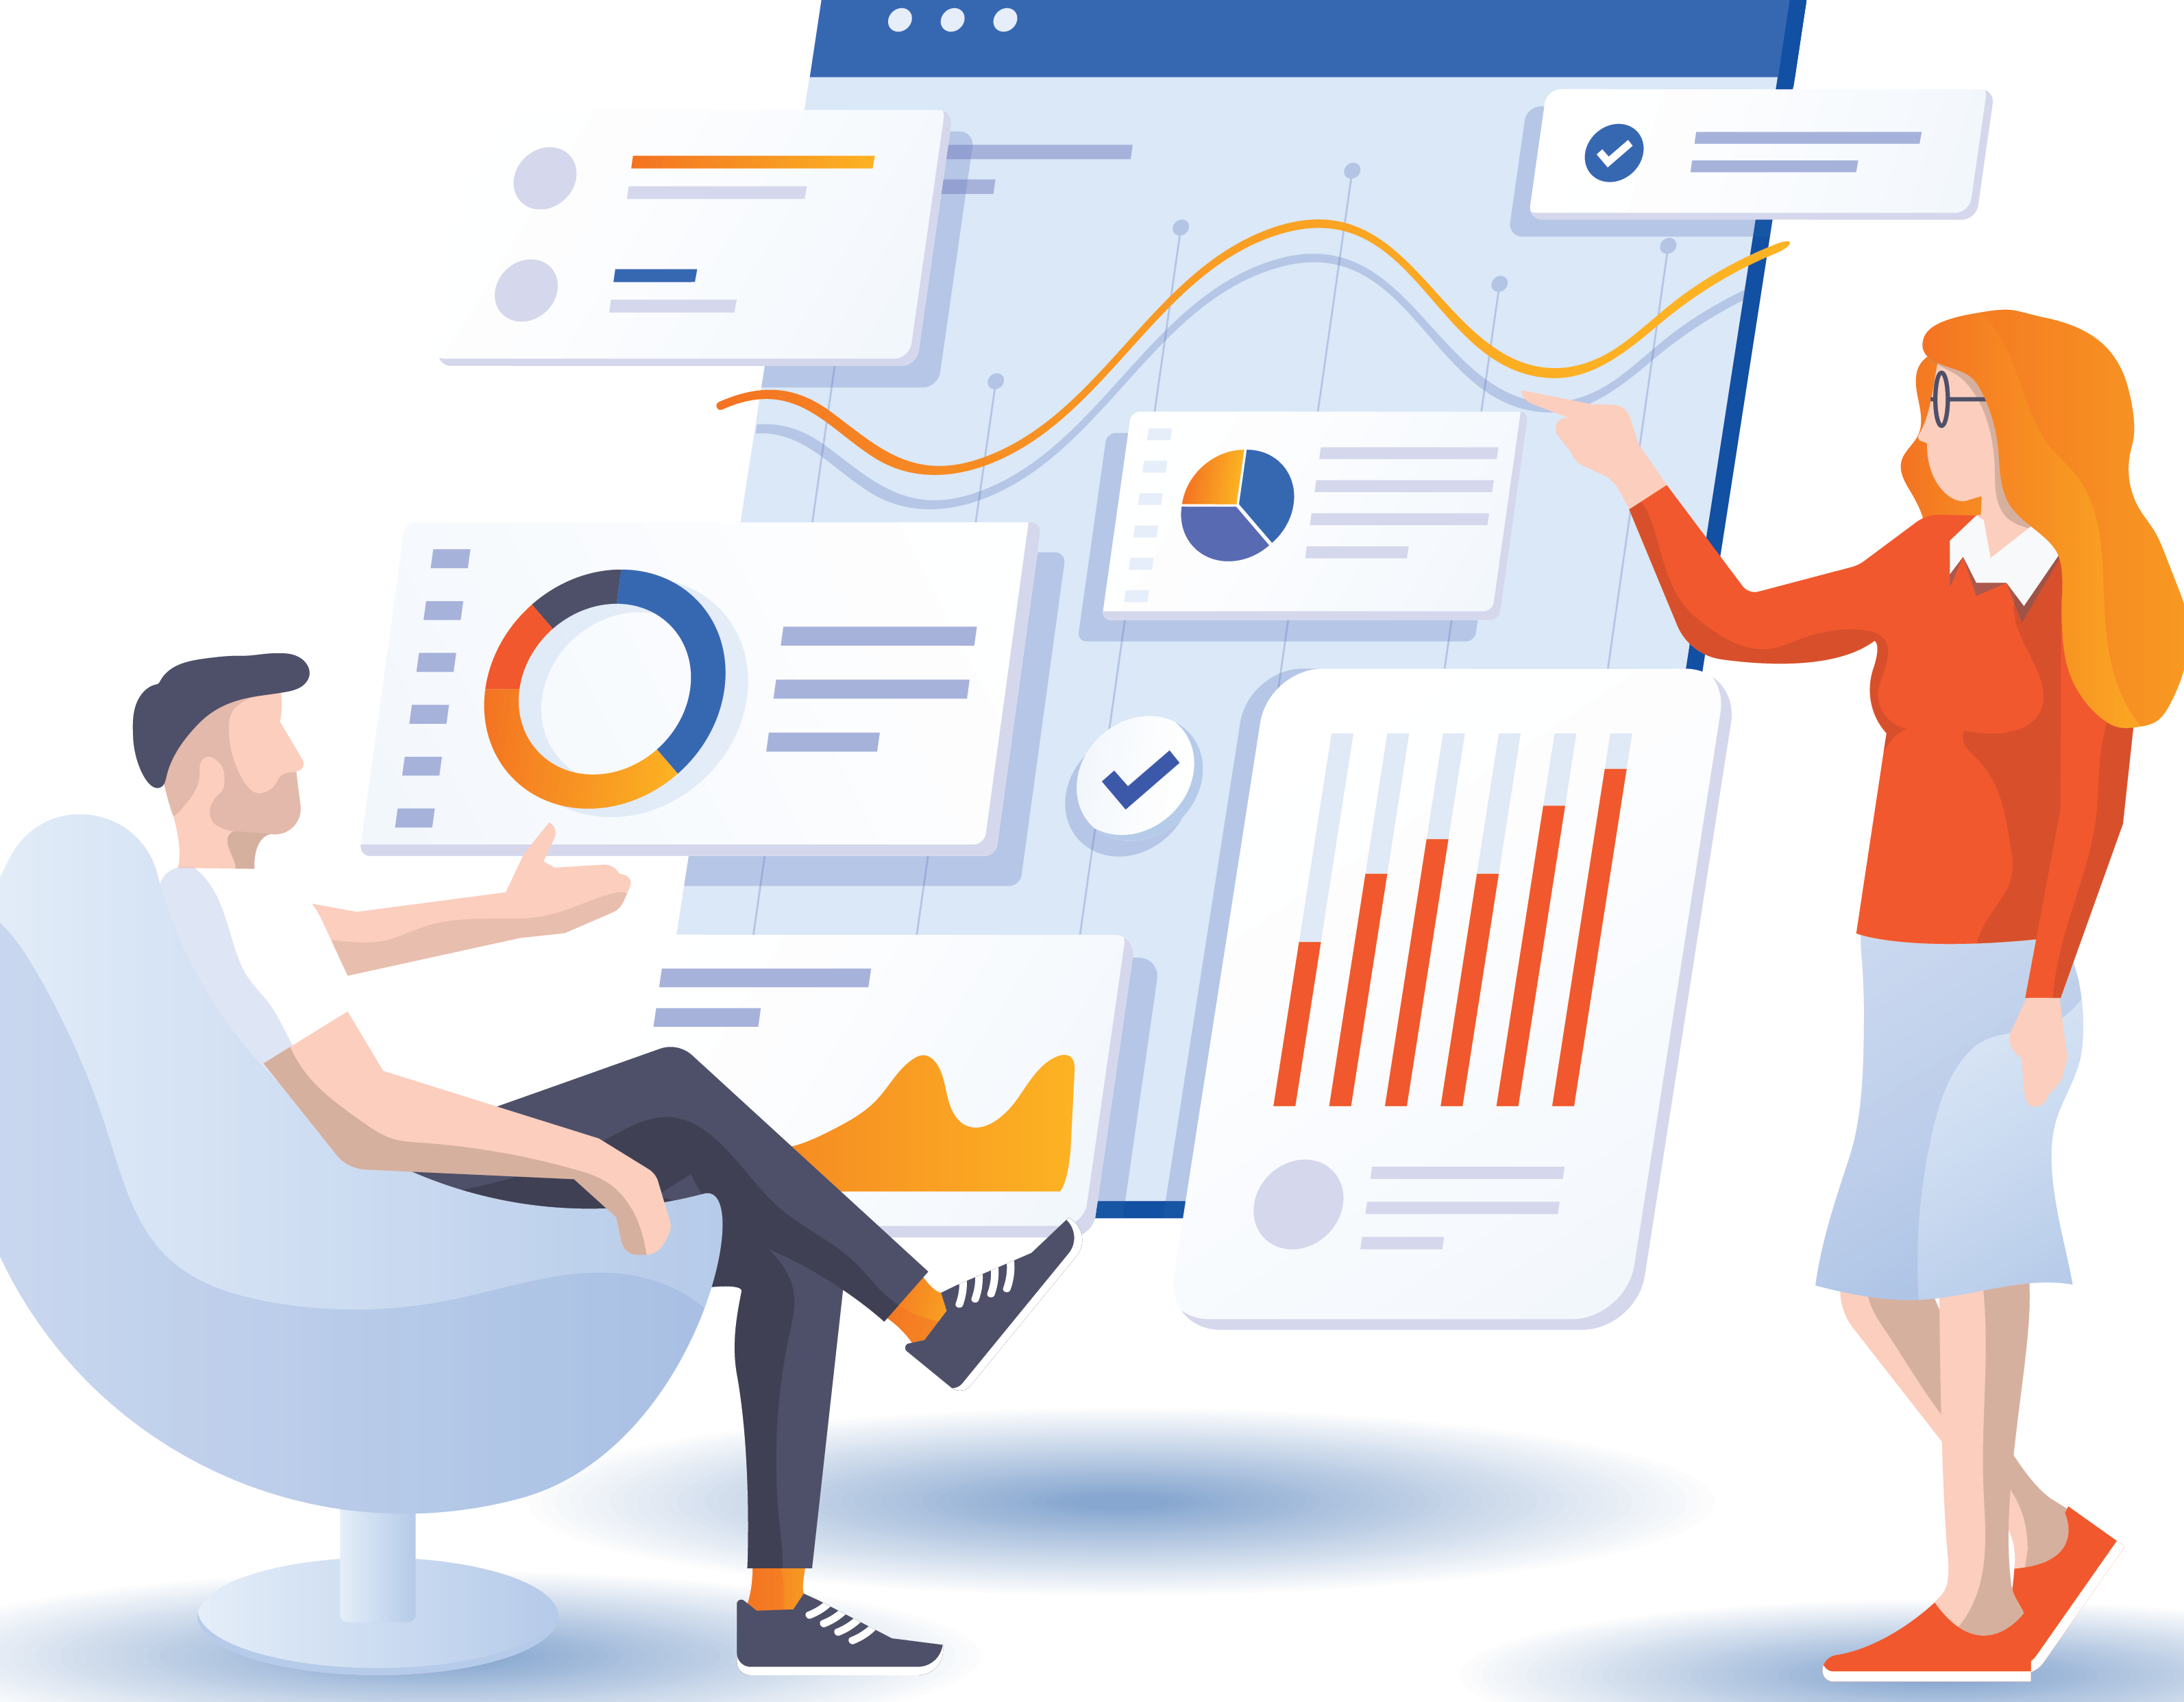
Get actionable insights from your data!
Attract. Manage. Develop. Engage. Retain. Grow.
A complete data management and visualization tool that will extract powerful insights from your HR data.
Humano HR Analytics aggregates data from multiple sources like: HCM, Payroll, ATS, LMS, Excel, etc. and creates real time KPI’s, dashboards and reports.
This way you can better understand company culture, improve productivity and performance, increase retention and create better work conditions for your people.
What is Humano HR Analytics?
* An end-to-end solution for your analytics needs built on Microsoft Power BI
* Single Reporting Environment that integrates data from multiple sources
* A tool with dashboards, reports and HR analysis for data driven decisions
* Customized to your needs
* On Premise and/or Cloud
* Cost effective & flexible – you can build your own reports
* We offer advisory on what & how to measure and also support you with the interpretation of your data
Understand the whole employee lifecycle:
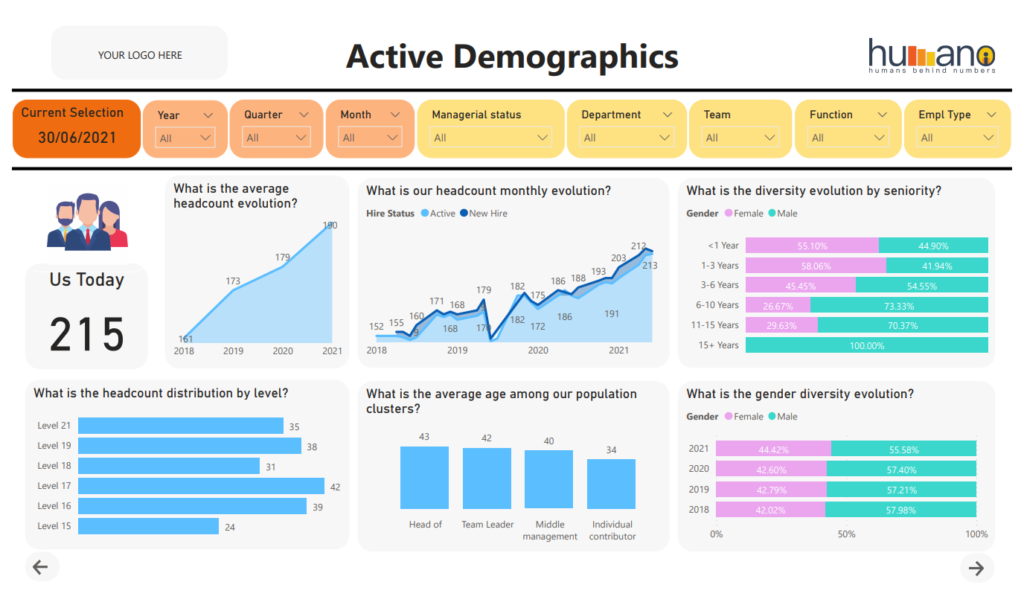
Demographics & Diversity
Statistics on the active employee population in a selected timeframe. Understand your employee population demographics and diversity. Explore and drill down on metrics like: average age, tenure on different employee clusters, gender diversity, management diversity, etc.
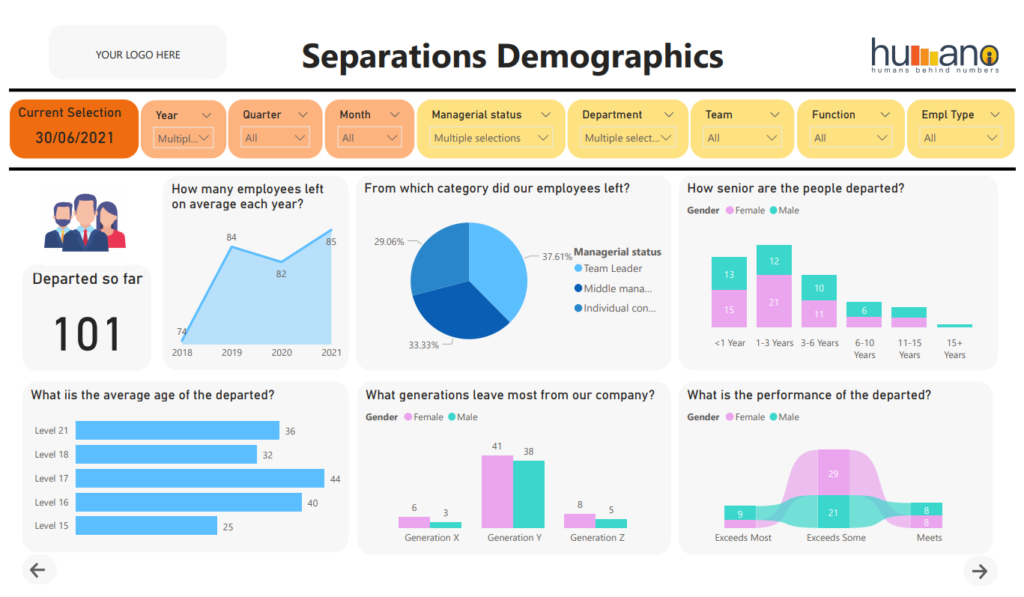
Separations
You can see the same statistics as in the active demographics reports and dashboards but this time on the employee population that left the company in a selected timeframe. Understand profiles, costs, reasons and gain insights for effective intervention to prevent attrition.
Recruitment
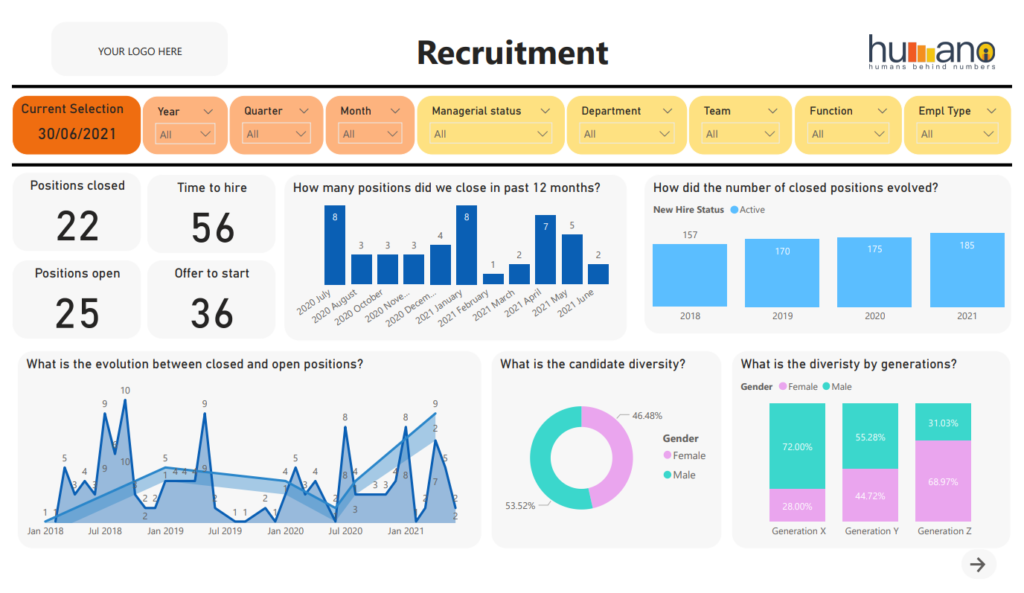
Dashboards, reports & metrics based on available recruitment data. Understand how you can improve the recruitment process. Drill-down on positions, recruiters, process related bottle-necks and slice & dice on your relevant segmentations. Analyse metrics like: time to hire, offer acceptance rate, recruitment funnels, effective sources of hire, etc.
Attrition
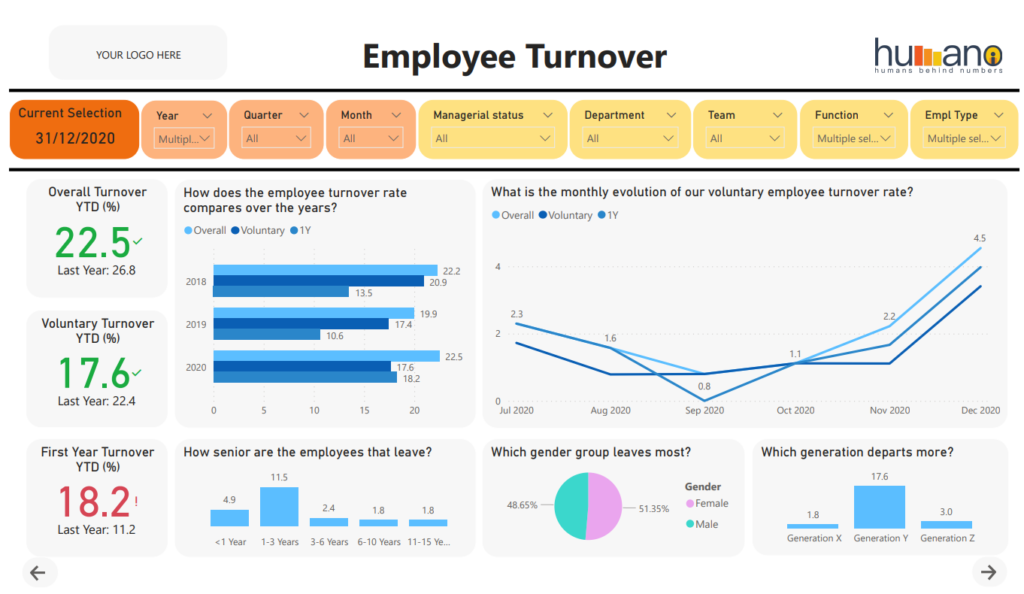
Understand why people leave and how you can increase retention of your talent. Analyse your employee turnover rate on the most relevant dimensions: voluntary and early attrition. Get a deep understanding of the reasons why people leave and the costs involved. Employee turnover is mirrored by the retention rate analysis.
Payroll
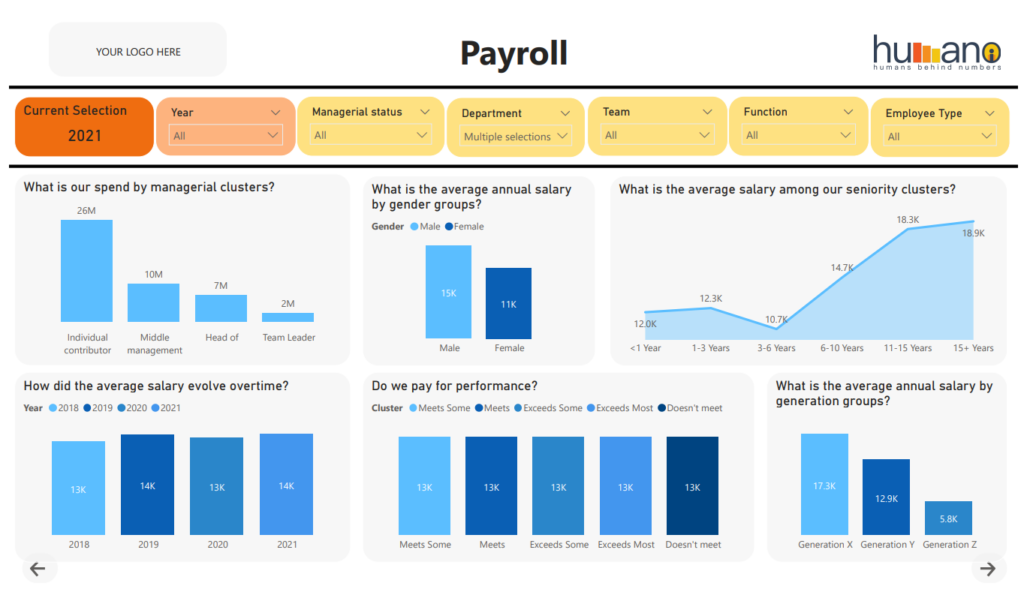
Analysis of the payroll budget on all salary elements to understand if you have an effective allocation. Learn trends on the average salaries between different employee levels and diversity groups. Filter, split, slice & dice on different important segments like: departments, generations, functions, business units, etc.
Compensation & Benefits
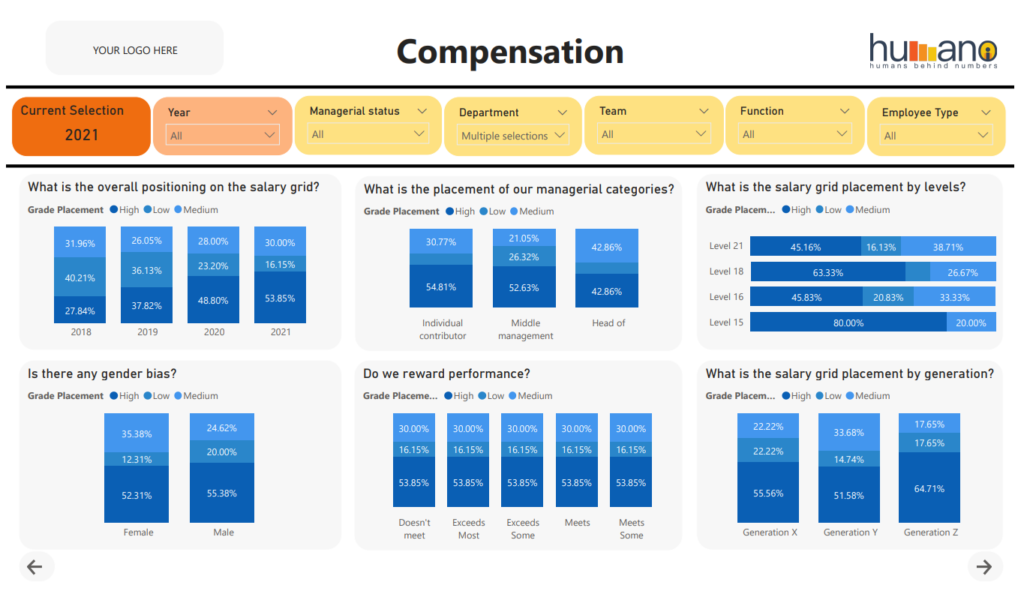
A comprehensive analysis of your reward practice versus your policy. An internal equity and external competitiveness analysis on all salary aggregates relevant for your company. Understand if you pay for performance and have in an instant a CR for each employee.
Performance
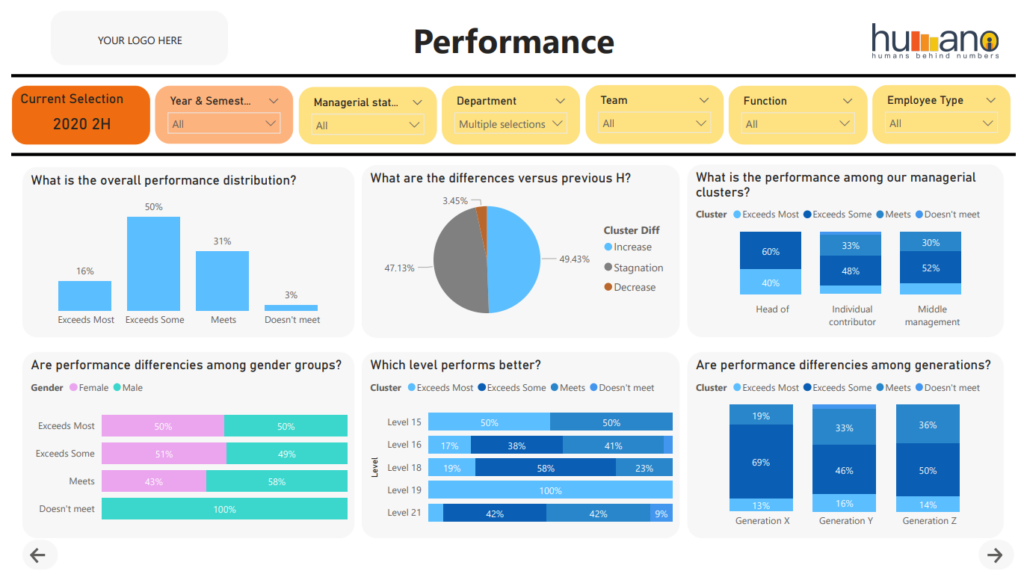
Statistics based on performance data for active and departed employees. See how performance evolves and understand where you need to invest. Analyse performance using multiple lenses like: gender diversity, generation differences, correlation between manager and team performance, pay for performance, etc.
Learning & Development
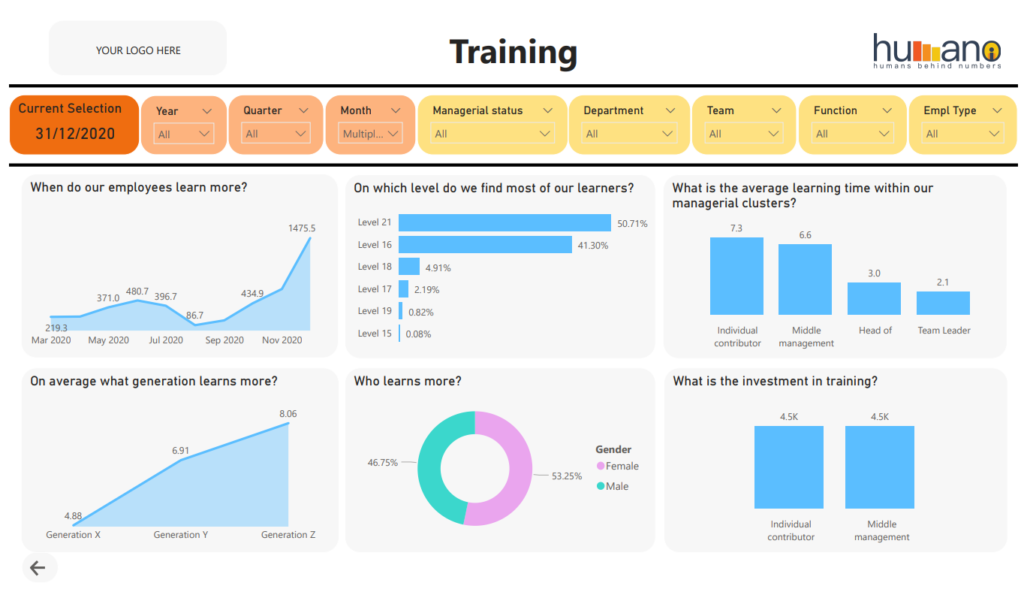
How do you stand in terms of learning and costs? Analyse your data and understand costs per categories, investment, who are your top learners and when does learning occur.
Absenteeism
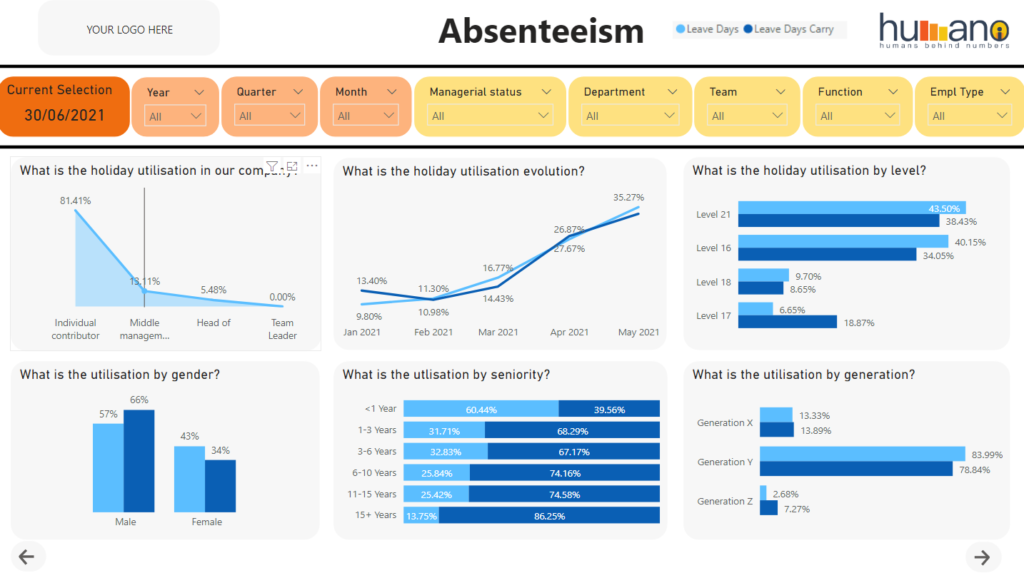
Understand trends regarding vacation, medical leaves and any other type of absenteeism that occurs in your company. Monitor the usage of vacation days and carried over days and mitigate potential risks. See the statistics important for you and your managers.
Overtime
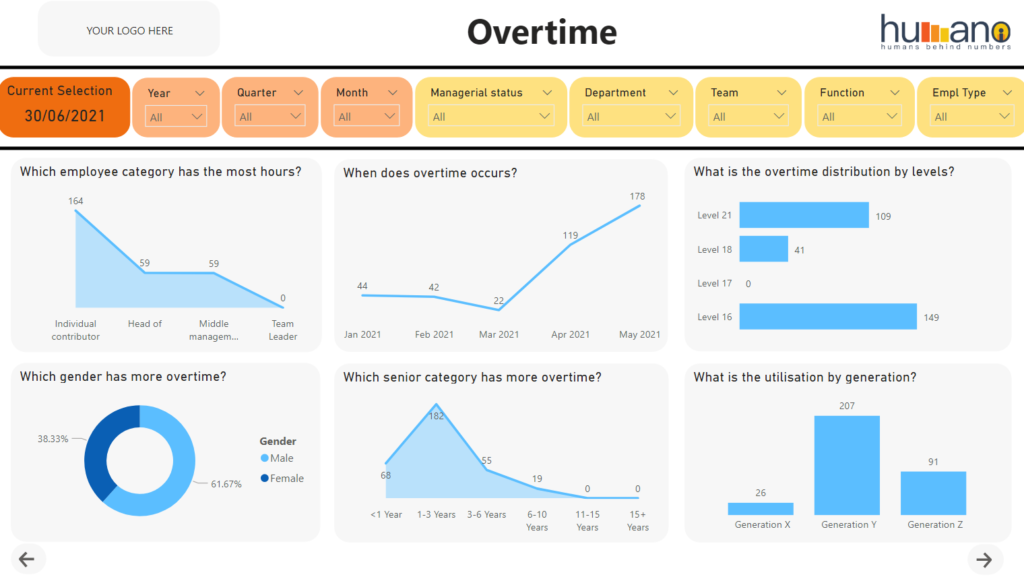
Analyse trends regarding overtime hours. Manage costs and mitigate burnout risks. You can see statistics on different segmentations like: level, department, seniority, gender, performance, pay, etc. You can create your own reports, dashboards and visualisations.
Department & Employee
It’s important to have dashboards easy to share with your peers. Get a snapshot of the most important KPIs for each department/function/business unit/etc. and share them with each colleague. Facilitate meaningful discussions among board, management, HR and teams through cluster and employee dashboards.
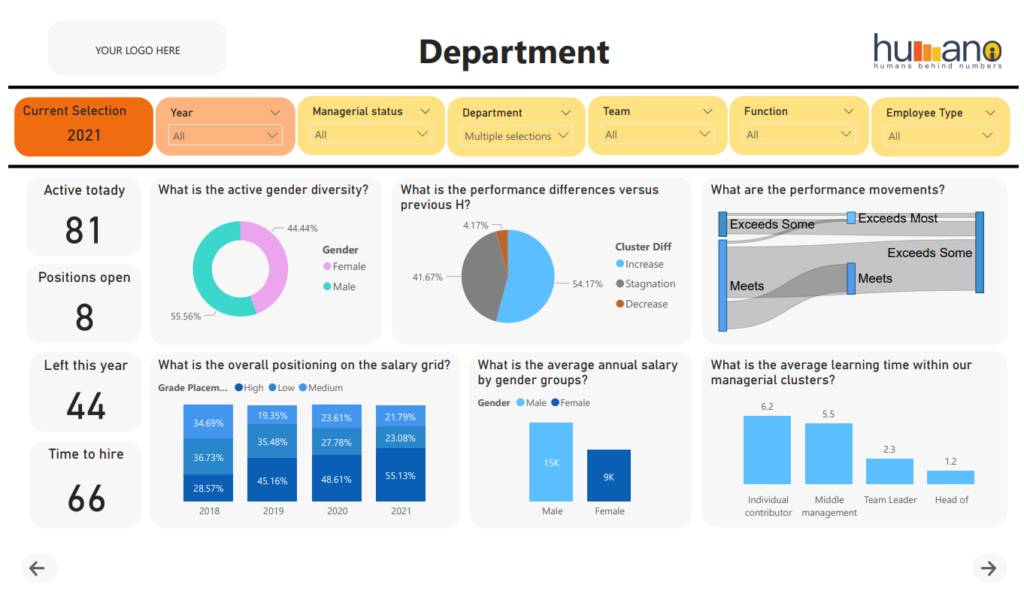
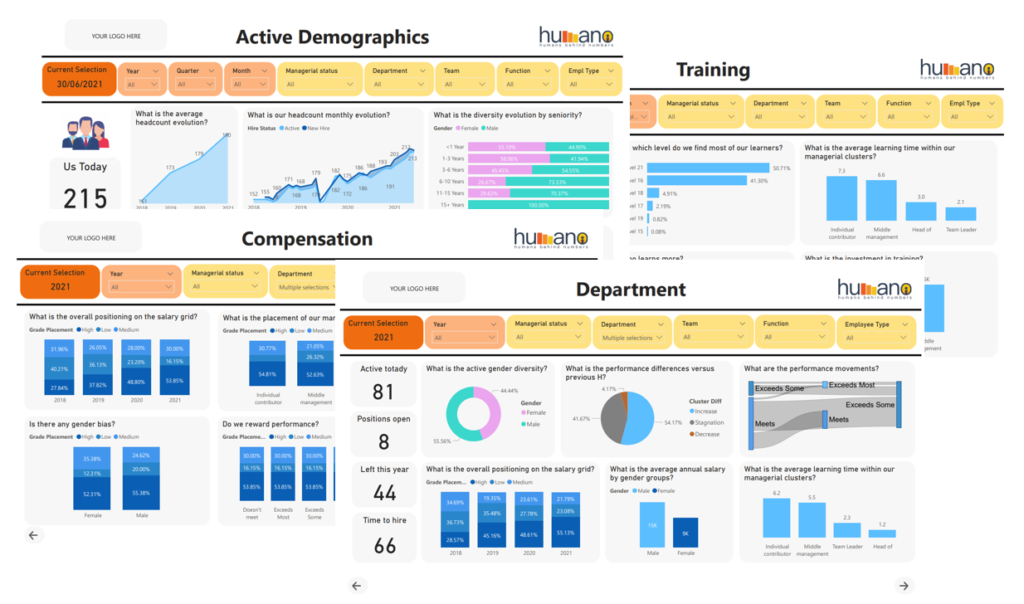
Custom Dashboards, Reports & Visualizations
We can create custom reports & dashboards on any data you have: industry, business, financial, sales, etc.
* Everything is customizable from the design, filters to the dimension for each visualization.
* You can create new reports, dashboards, metrics, visualizations whenever you need them. Additionally, you can drill down or you can focus on each visualization.
* Add at any time new data, clean it, link it with the existing data and analyse it.
These are just a few of the features available.
Request a demo!
Understand how Humano HR Analytics can support your company’s development.
Request a personalized demo and answer all your questions.
